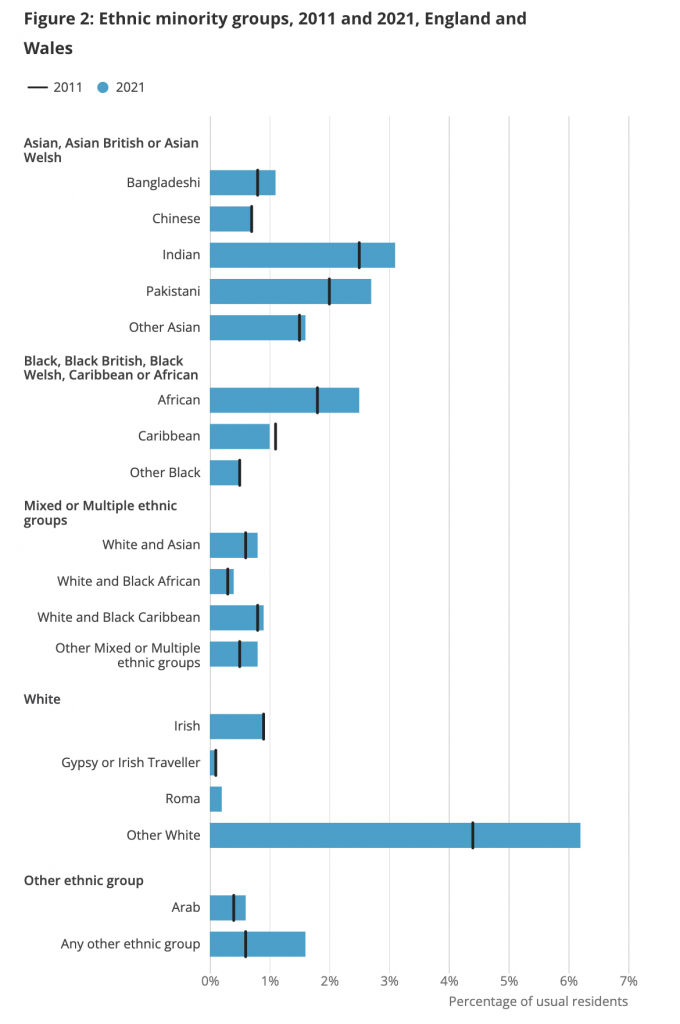
These statistics have been taken from the 2021 Census which uses a standardised list of 19 ethnic groups which slightly differs from the 2011 Census ethnic groups in that the ‘Roma’ group was added under the ‘white’ ethnic group, and people could write their own response under the ‘black African’ ethnic group.
Ethnicity
According to the Office for National Statistics, there were approximately 59.6 million people living in England and Wales in mid-2021. Of these, 48.7 million (86.0 per cent) were White British.
The most recent Census in 2021 also highlights that in England and Wales, 81.7 per cent of the population were white British. Asian (Pakistani, Indian, Bangladeshi, other) ‘groups’ made up 9.3 per cent of the population; black groups 4.0 per cent; Chinese groups 0.7 cent, Arab groups 0.6 per cent and other groups 1.6 per cent.
In London in 2021, 36.8 per cent (3.2 million) of 8.8 million usual residents were White British.
83.2 per cent of those in England and Wales were born in the UK. Of those not born in the UK, 9 per cent were born in India, 7 per cent in Poland and 6 per cent in Pakistan.
The table below shows changes in the proportion (by percentage points) of the population of England and Wales, by ethnicity, between 2011 and 2021.
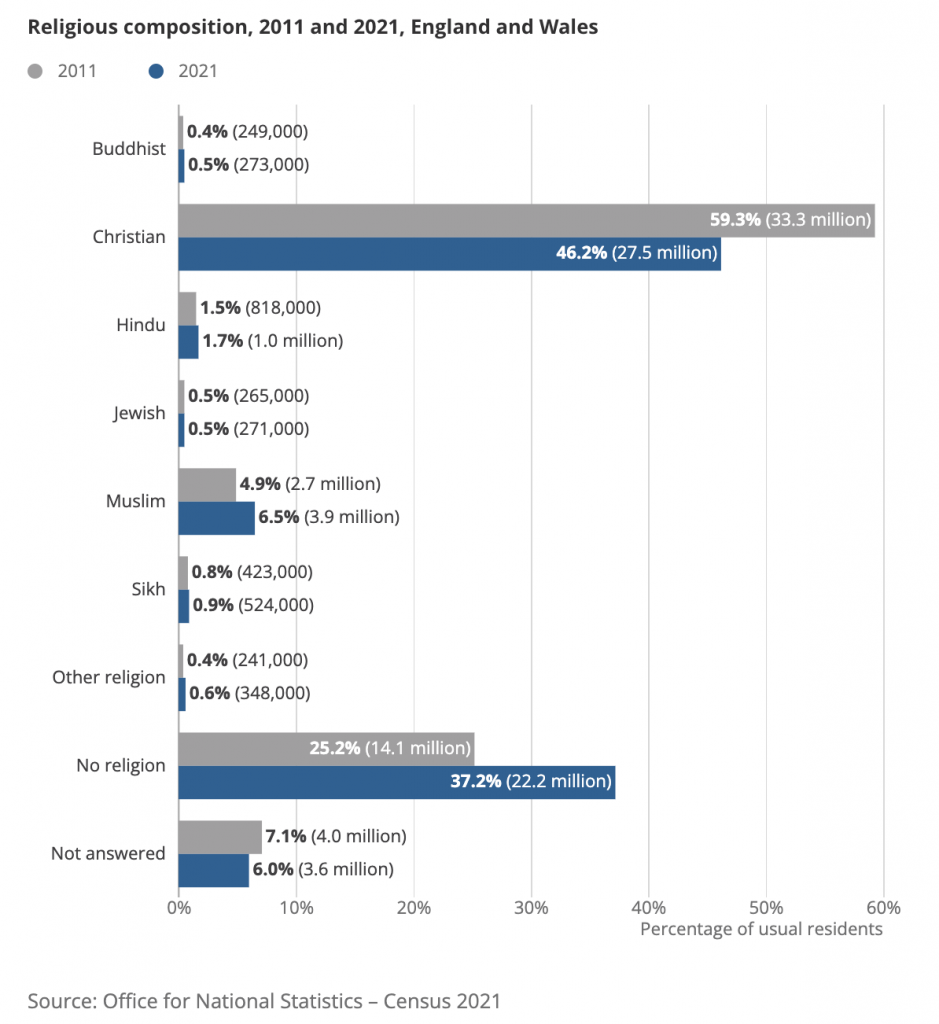
Religion
In the 2021 Census, 46.2 per cent of the population of England and Wales identified as Christian. The second largest religious group comprised Muslims (3.9 million people, 6.5 per cent of the population).
NB: This is all using England and Wales statistics as UK-wide ones were not available with consistent dates.